
Is car crime getting worse in the Greater Heights? Here’s what the HPD data shows
You asked me if we’re seeing more car thefts and break-ins. So what’s the answer? I analyzed thousands of HPD crime reports to find out what the data actually shows, where vehicle-related crimes are happening most and whether the time of year makes a difference.
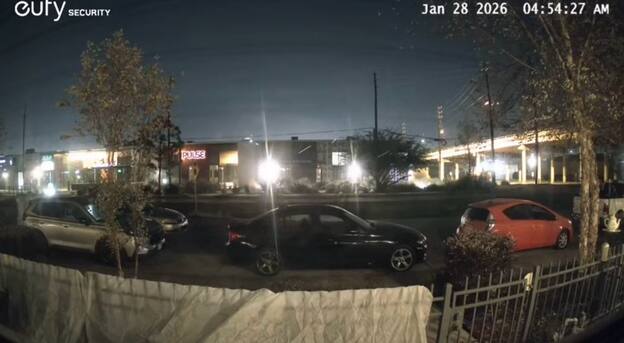
Many of you across the Greater Heights have been telling me you’re seeing more car thefts, break-ins and stolen vehicle parts in your neighborhoods.
But is car crime actually increasing?
To find out, I analyzed thousands of Houston Police Department crime reports from three ZIP codes covering the Greater Heights area, and slightly beyond: 77007, 77008 and 77009.
What do you think?
Share your thoughts in the comments.
Even though these ZIP codes extend beyond the boundaries of the area typically cover, these are the ones I used to provide a consistent geographic area for analyzing the data.
The analysis looked at three categories of vehicle-related crime: motor vehicle theft, theft from motor vehicles and theft of vehicle parts.
And the results?
Motor vehicle theft has actually stayed relatively steady
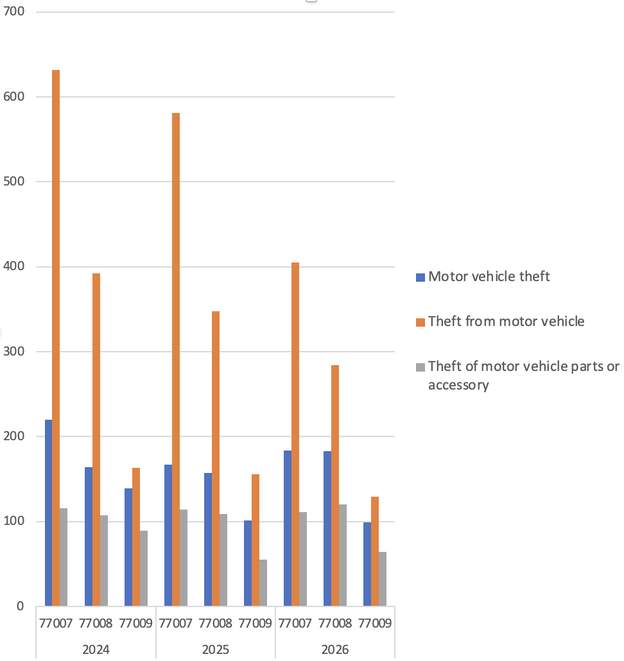
The number of reported motor vehicle thefts has slightly fluctuated over the past three years, but the first six months of 2026 remain relatively close to the numbers recorded during the same period in 2024 and 2025.
There were 523 reported motor vehicle thefts during the first six months of 2024, compared with 425 during the same period in 2025 and 466 in the first six months of 2026.
That means motor vehicle thefts increased from the first half of 2025 to the first half of 2026, but remained lower than in 2024.
Car break-ins have declined
The data shows a more pronounced change when looking at thefts from vehicles, or car break-ins.
There were 1,187 reported thefts from vehicles during the first six months of 2024.
That number fell to 1,085 during the first six months of 2025 and 818 during the first six months of 2026.
That represents a substantial decline in reported thefts from vehicles over the three-year period. Surprised? Me too.
What about stolen car parts? Also, steady data
The number of reported vehicle-part thefts has also remained below the 2024 level, although the change has been smaller.
There were 312 reported thefts of vehicle parts during the first six months of 2024, compared with 278 in the first six months of 2025 and 295 during the first six months of 2026.
Vehicle-part thefts increased slightly from 2025 to 2026, but remained below the number reported during the first half of 2024.
Where is car crime happening the most?
The HPD data can also be broken down by street.
For this part of the analysis, we looked at reports from Jan. 1, 2024, through June 30, 2026, and identified these streets with the most reported vehicle thefts:
- Washington
- N Loop W
- Memorial
- T.C. Jeseter
- 20th
- Shepherd
- Yale
- 18th
- 24th
- Leona
The same analysis was done to find the streets with the most car break-ins:
- Shepherd
- Washington
- 19th
- Memorial
- 20th
- Heights
- N Loop W
- Yale
- Allen
- White Oak
Does the time of year matter?
HPD’s data does not provide the time of day for these reports, but the reports can be analyzed by month.
The data shows a seasonal pattern in reported motor vehicle thefts, with numbers generally higher during the summer months and lower during the winter.
The pattern is somewhat similar for thefts from vehicles, although the month-to-month fluctuations are less consistent.

So what does this mean?
The data provides one way to put your concerns into context.
While many of you continue to report vehicle-related crime and share surveillance video, the HPD data analyzed here does not show a broad increase across these categories.